

| |
|
Subscribe To

 Posts
All Comments
Posts
All Comments
Wednesday, August 22, 2012
Microsoft: Left in the Dust - and Brimming with Value


Friday, August 3, 2012
Europe: Uncertainty and Opportunity
The sovereign debt crisis in Europe and subsequent worldwide economic slowdown has been the top news story and at the forefront of many investors’ minds for nearly 3 years. Fiscal austerity, likely restructuring of the debt of the peripheral sovereigns, and a reluctance to implement needed structural reforms within the European Union (namely, more centralized control of member country finances) will present a persistent headwind to global economic growth. Yet, in this environment of uncertainty and pessimism, we believe there are excellent investment opportunities; one simply needs to dig a little deeper to unearth them.

In March 2009 the economic outlook looked grim for the United States. The bursting of the housing bubble and melt down in the mortgage market engendered a massive liquidity crunch that froze credit markets. Economic activity fell precipitously; and with so much bad debt in the system, it was hard to imagine business activity wouldn’t continue to deteriorate – never mind see improvement. And yet, as Table 2 illustrates, an investment in the S&P 500 in March 2009 provided a return of 85% (price only) through June of this year. Historic rallies are born in the depths of crises.


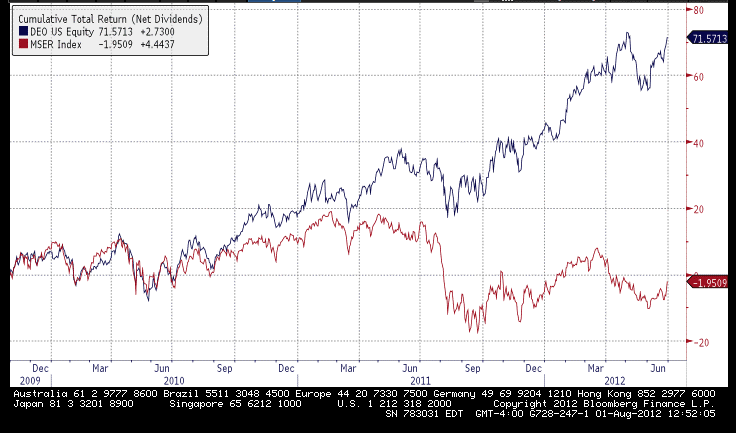
A specific example of a European stock that we have liked for several years now is Diageo. It has provided excellent returns since the beginnings of the Greek crisis in October of 2009. As Chart 1 shows Diageo (Ticker: DEO) has provided a total return of almost 72% since October 30, 2009, far exceeding the MSCI Euro Index total return of -1.9%. At the time we found the valuation of the shares of this high-quality company very attractive: the cash flow yield was 8.5%, the earnings yield was over 7%, and the dividend yield approached 4%. This is a perfect example of a great company with attractive yields providing a wonderful investment opportunity in a horrible economic environment.
Looking forward, the MSCI Euro Index looks attractive to us. Table 4 compares where the MSCI Euro Index was in October 2007 and where it is today. Good relative investment returns might come from eventual margin expansion, and the index’s high current earnings and dividend yields.


We are also finding companies with healthy businesses (using the discounted cash flow models in a method described in detail in our last Research Note, “Healthcare Stocks: Attractively Valued No Matter What Happens in Washington”- July 10, 2012), that are priced as if they are in permanent decline. Two examples that fit this description are in Table 5.
Tuesday, July 10, 2012
Heathcare Stocks Attractively Priced
We’ll leave the legal analysis of the recent Supreme Court rulings regarding the Affordable Healthcare Act to the pundits on the network news. Our priority is to preserve and grow our clients’ financial assets. In that vein, we continue to find attractive investment values in high quality healthcare companies. Relative to most other opportunities, we believe these investments will perform well whatever form healthcare reform ultimately takes.
The chart below compares the S&P Healthcare Index (the dark blue line, which consists of the largest 52 US healthcare companies) and the S&P 500 (the red line, the most widely used proxy for the US stock market). The date range is from March 23, 2010 – the day President Obama signed the Affordable Healthcare Act into law – and the current date (July 5, 2012).
 The chart shows – perhaps surprisingly – that healthcare companies as a group have performed almost exactly in line with the S&P 500. Moreover, on the day of the historic Supreme Court ruling supporting the individual insurance mandate, the healthcare index responded with a big yawn, and performed in line with the overall market. This suggests to us the potential negative impacts of the Affordable Healthcare Act had been priced into healthcare stocks for some time.
 The last column tells the most interesting story from an investing standpoint but it requires an explanation. The “Price-Implied Forward Growth Rate” represents the future growth rate required to support the current price of each company based upon several simple assumptions and inputs we use to calculate this. We solve a “growth equation” for the future growth rate implied from today’s stock price[1]. This contrasts with the conventional way of applying this equation in which an analyst uses a projected growth rate to solve for a target price (a method commonly used by Wall Street analysts).
The chart below compares the S&P Healthcare Index (the dark blue line, which consists of the largest 52 US healthcare companies) and the S&P 500 (the red line, the most widely used proxy for the US stock market). The date range is from March 23, 2010 – the day President Obama signed the Affordable Healthcare Act into law – and the current date (July 5, 2012).
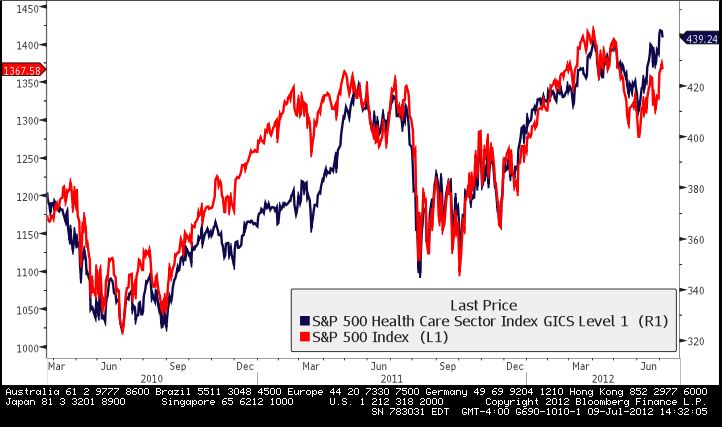 The chart shows – perhaps surprisingly – that healthcare companies as a group have performed almost exactly in line with the S&P 500. Moreover, on the day of the historic Supreme Court ruling supporting the individual insurance mandate, the healthcare index responded with a big yawn, and performed in line with the overall market. This suggests to us the potential negative impacts of the Affordable Healthcare Act had been priced into healthcare stocks for some time.
The table below is a sample of companies we currently find attractive. As the first two columns show, these companies boast an average free cash flow yield of 8% and an average dividend yield of 3.1%. – which compares very favorably to the 10 year treasury yield of 1.6%.
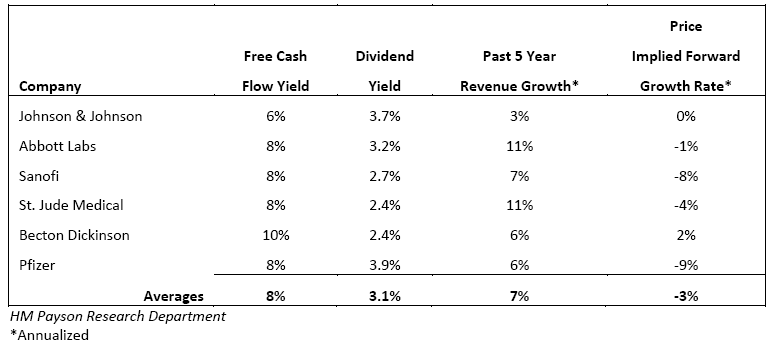
By solving for the growth rate instead of attempting to predict it, we can better understand the market assumptions underlying the price and begin to identify the better relative values. As shown in the table, the current prices of the six companies imply that revenues will decline 3% annually, in perpetuity. This seems too pessimistic to us.
Even in an environment of more regulation and less price inflation, healthcare companies will probably experience some growth from new products, aging populations in developed countries, global population growth, and increased exports to emerging markets. Furthermore, the companies mentioned have the cash flows and financial flexibility to enhance shareholder value with increased dividends and share repurchases.
In conclusion, as is so often the case in investing, market uncertainty can present opportunities to invest at lower prices. The ongoing healthcare reform debate is just the latest example. The shares of many quality healthcare companies offer generous yields and the potential for price appreciation as the uncertainty is eventually replaced by actual results. Therefore, we maintain a generous representation of healthcare stocks in our clients’ portfolios.
In conclusion, as is so often the case in investing, market uncertainty can present opportunities to invest at lower prices. The ongoing healthcare reform debate is just the latest example. The shares of many quality healthcare companies offer generous yields and the potential for price appreciation as the uncertainty is eventually replaced by actual results. Therefore, we maintain a generous representation of healthcare stocks in our clients’ portfolios.
[1] This calculation is based upon an equation, widely used in finance, known as the “Discounted Cash Flow Model.“
Monday, October 3, 2011
Friday, June 24, 2011
Investment Idea - Life Technologies (LIFE)
Business
Life Technologies Corp. is a “picks and shovels” type business in the biotech industry. It has three main product groups: 1) molecular systems which produce products used to prepare biological samples and analyze gene functions, 2) cell systems which produce products used to grow cells and analyze cell functions and, 3) genetic systems which produce products used to sequence and analyze DNA.
The business has several attractive characteristics. First, the company sells into diversified end markets including hospitals, commercial applications, biotech and pharma, and academic and government research laboratories. End market uses include forensic testing, molecular medicine, synthetic genomics, food safety, and animal health. Second, the majority of the revenue stream is recurring. Consumables and services make up about 80% of revenues with instruments sales contributing the remaining 20%. Third, the company sells into a diverse geographic footprint. The Americas, which includes North and South America, make up about 50% of sales, Europe 32%, Japan 10%, and Asia-Pacific the remainder 10%. Growth is positive in all markets. Emerging markets, which make up about 10% of revenues, are currently growing at about 30% per annum.
Consensus Viewpoint
The majority of sell-side analysts have included margin and top line growth into their models as evidenced by consensus estimates.
The current share price, however, does not reflect future margin improvement or growth potential. This suggests that the market is either 1) unaware or misunderstands margin and growth opportunity or, 2) is skeptical of the story. As a significant portion of revenue comes from government funded biotech research, perhaps some anticipated funding cuts are already priced into shares.
Investment Thesis
LIFE shares have two main valuation improvement levers: 1) margin improvement and, 2) growth potential.
The creation of LIFE in 2008 through the merger of Invitrogen and Applied Biosciences created an entity with large potential synergies relating to cost reduction. There are several post merger margin improvement opportunities in the areas of manufacturing productivity, supply chain efficiencies, and fixed cost leverage. Management’s goal of expanding operating margins by 230 basis point over the next two or three years seems reasonable given the large redundancies between the legacy Invitrogen and Applied Biosciences businesses. A reading of LIFE’s proxy statement reveals that part of executive compensation is directly tied to ‘synergies’ giving a direct incentive to boost profitability. Using Economic Value Added (EVA) based discounted cash flow models, margin improvements prospects do not appear to be reflected the current share price.
The company makes equipment and consumable products used in the study of genes and proteins. The end uses of these products are growing rapidly, even in slower growth developed economies. LIFE’s products are used in the fast growing fields such as forensic testing, molecular medicine, food and water safety, and synthetic biology. As an example, LIFE products were used in the recent E. coli crisis in Germany. While assuming an above average growth rate in valuation models would seem reasonable, the current price does not reflect a large growth premium. Investors are getting a low cost (or possibly free) growth call option.
Valuation
Using the concept of Earnings Power Value (as defined by Columbia professor Bruce Greenwald in his book Value Investing), we approximate the no growth value of LIFE shares to be between the mid 40’s and 60 suggesting investors are not paying much (if anything for growth) at the current market price.
Our valuation estimate assumes 5% top line growth and continued margin expansion. By 2012 the top line should be about $4 billion with 35% EBITDA margins. Using TEV/EBITDA multiple of 10x with a reduce shares outstanding count of 170 million (management has indicated share buybacks are a cash use priority) we come to an intrinsic value of $70 per share.
Life Technologies Corp. is a “picks and shovels” type business in the biotech industry. It has three main product groups: 1) molecular systems which produce products used to prepare biological samples and analyze gene functions, 2) cell systems which produce products used to grow cells and analyze cell functions and, 3) genetic systems which produce products used to sequence and analyze DNA.
The business has several attractive characteristics. First, the company sells into diversified end markets including hospitals, commercial applications, biotech and pharma, and academic and government research laboratories. End market uses include forensic testing, molecular medicine, synthetic genomics, food safety, and animal health. Second, the majority of the revenue stream is recurring. Consumables and services make up about 80% of revenues with instruments sales contributing the remaining 20%. Third, the company sells into a diverse geographic footprint. The Americas, which includes North and South America, make up about 50% of sales, Europe 32%, Japan 10%, and Asia-Pacific the remainder 10%. Growth is positive in all markets. Emerging markets, which make up about 10% of revenues, are currently growing at about 30% per annum.
Consensus Viewpoint
The majority of sell-side analysts have included margin and top line growth into their models as evidenced by consensus estimates.
The current share price, however, does not reflect future margin improvement or growth potential. This suggests that the market is either 1) unaware or misunderstands margin and growth opportunity or, 2) is skeptical of the story. As a significant portion of revenue comes from government funded biotech research, perhaps some anticipated funding cuts are already priced into shares.
Investment Thesis
LIFE shares have two main valuation improvement levers: 1) margin improvement and, 2) growth potential.
The creation of LIFE in 2008 through the merger of Invitrogen and Applied Biosciences created an entity with large potential synergies relating to cost reduction. There are several post merger margin improvement opportunities in the areas of manufacturing productivity, supply chain efficiencies, and fixed cost leverage. Management’s goal of expanding operating margins by 230 basis point over the next two or three years seems reasonable given the large redundancies between the legacy Invitrogen and Applied Biosciences businesses. A reading of LIFE’s proxy statement reveals that part of executive compensation is directly tied to ‘synergies’ giving a direct incentive to boost profitability. Using Economic Value Added (EVA) based discounted cash flow models, margin improvements prospects do not appear to be reflected the current share price.
The company makes equipment and consumable products used in the study of genes and proteins. The end uses of these products are growing rapidly, even in slower growth developed economies. LIFE’s products are used in the fast growing fields such as forensic testing, molecular medicine, food and water safety, and synthetic biology. As an example, LIFE products were used in the recent E. coli crisis in Germany. While assuming an above average growth rate in valuation models would seem reasonable, the current price does not reflect a large growth premium. Investors are getting a low cost (or possibly free) growth call option.
Valuation
Using the concept of Earnings Power Value (as defined by Columbia professor Bruce Greenwald in his book Value Investing), we approximate the no growth value of LIFE shares to be between the mid 40’s and 60 suggesting investors are not paying much (if anything for growth) at the current market price.
Our valuation estimate assumes 5% top line growth and continued margin expansion. By 2012 the top line should be about $4 billion with 35% EBITDA margins. Using TEV/EBITDA multiple of 10x with a reduce shares outstanding count of 170 million (management has indicated share buybacks are a cash use priority) we come to an intrinsic value of $70 per share.
Sunday, February 13, 2011
Risk and the Value Investor
The continued adherence to efficient market theory ironically makes the market less efficient. The reason: the data hungry models used to describe optimal portfolio asset allocation equate volatility with risk. The models are indifferent to whether assets are cheap or expensive in terms of current relative and absolute yields.
The obsession with this one dimensional measure of risk may actually work against the prudent man rule. In the aftermath of the 2008 credit crunch, many professional fiduciaries, as advised by their consultants, actually increased their allocation to bonds. They did this even as the benchmark 10 year Treasury Bond yielded 2.5% (a multiple of 40 times "earnings").
The value investor's view of risk differs from the conventional view. A value investors' definition of risk is permanent capital impairment. As Dr. Michael Burry puts it in Michael Lewis's book The Big Short "real risk is stupid investment decisions". Investment success always comes down to one thing: the price paid. Everything is a buy at one price and a sell at another. Risk always increases as the price goes up.
The obsession with this one dimensional measure of risk may actually work against the prudent man rule. In the aftermath of the 2008 credit crunch, many professional fiduciaries, as advised by their consultants, actually increased their allocation to bonds. They did this even as the benchmark 10 year Treasury Bond yielded 2.5% (a multiple of 40 times "earnings").
The value investor's view of risk differs from the conventional view. A value investors' definition of risk is permanent capital impairment. As Dr. Michael Burry puts it in Michael Lewis's book The Big Short "real risk is stupid investment decisions". Investment success always comes down to one thing: the price paid. Everything is a buy at one price and a sell at another. Risk always increases as the price goes up.
Friday, February 11, 2011
An Important Flaw of the Efficient Market Theory
"The same finance scholars who claimed that you couldn't predict future stock price movements by looking at past stock price movements were embracing the idea that future stock volatility could be predicted by looking at past stock volatility."
From The Myth of Rational Markets by Justin Fox
This theory is the cornerstone by which the consultant industry advises institutional investors. The theory, despite the above mentioned flaw in logic (and many other flaws) will be around for some time to come because 1) it provides a C.Y.A. blanket for institutional fiduciaries and 2) a lot of consultant and academic paychecks depend on it.
From The Myth of Rational Markets by Justin Fox
This theory is the cornerstone by which the consultant industry advises institutional investors. The theory, despite the above mentioned flaw in logic (and many other flaws) will be around for some time to come because 1) it provides a C.Y.A. blanket for institutional fiduciaries and 2) a lot of consultant and academic paychecks depend on it.
Subscribe to:
Posts (Atom)